
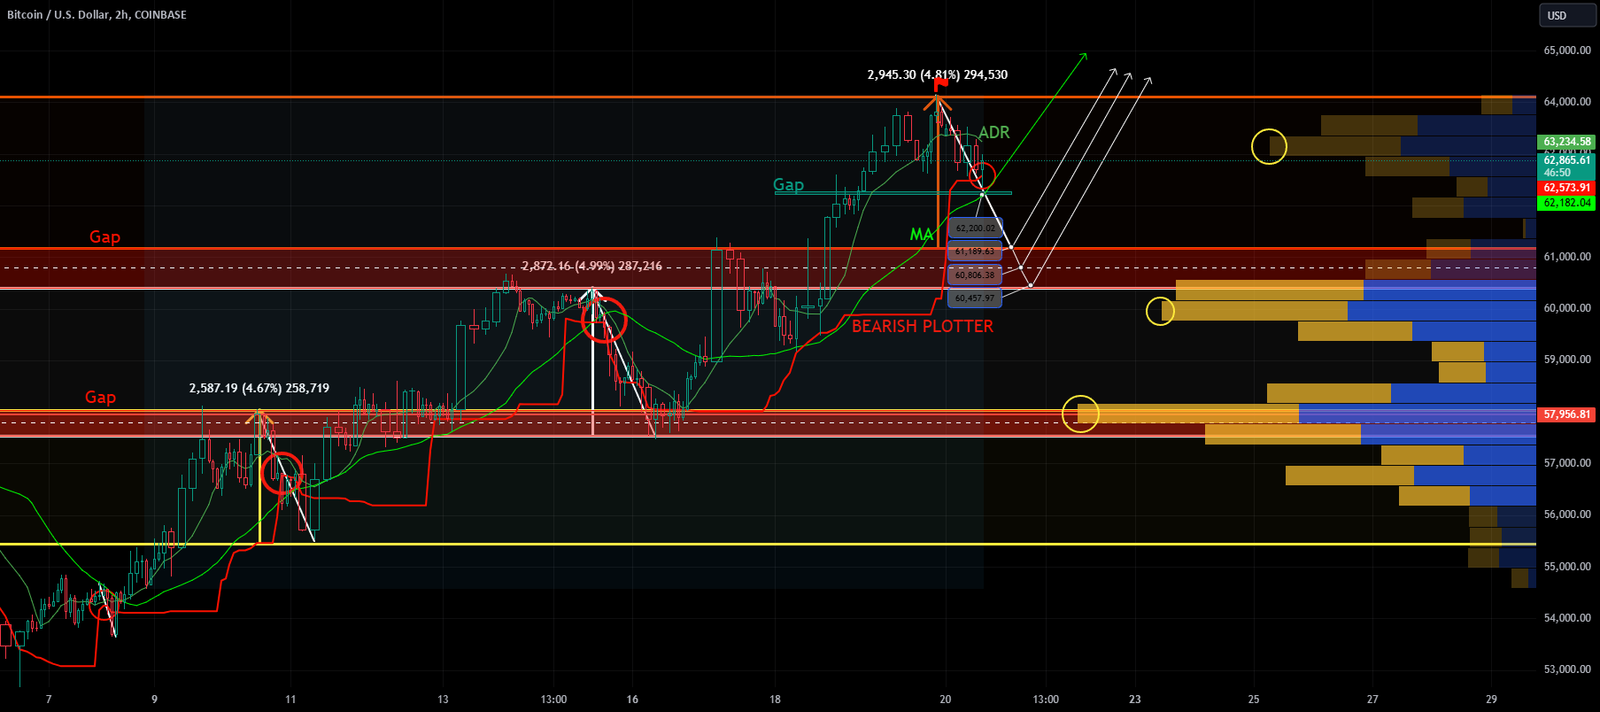
I wanted to use a higher timeframe, but the two-hour timeframe was more convenient because my bearish plotter is pointing out only the two-hour timeframe from all timeframes. This lets me know BITCOIN will make its way down for a minor trend.
I’ve done some price range measuring. I have two custom gaps left out in the open from all three measurements. This can only work with my bearish plotter.
Two red long rectangles are the left opened gaps which price can potentially hit those targets.
The green gap is genuine.
I drew a parallel trend line starting point from the top of the wick to the last bottom candle wick. I’ve measured the longest trendline and cloned it which is the most recent white parallel trendline.
BITCOIN is behaving as if it wants to keep pushing up. There’s no way of telling. It’s pushed up in the past on a daily timeframe regardless of stochastic RSI was overbought but don’t count on it.
Pay attention to the most recent candlestick. The candlestick has almost filled the green gap which my custom MA has predicted an uptrend moving forward but it is just guidance.
MY ADR MA, please follow it and see the way it plays out.
Summary:
Does this mean the price can fall to those 4 prices, it’s a possibility, but so far it’s touched the most recent green gap.
Based on a 2-hour volume, it all makes sense. We have three levels of the highest volume.
This is only a two-hour timeframe, it’s just guidance by using a strategy. I had to create my own gaps. As I created them; WALA!, look at the first red gap
let’s see how it plays out, so don’t panic. We’re in a 3-YEAR BULL RUN.
