
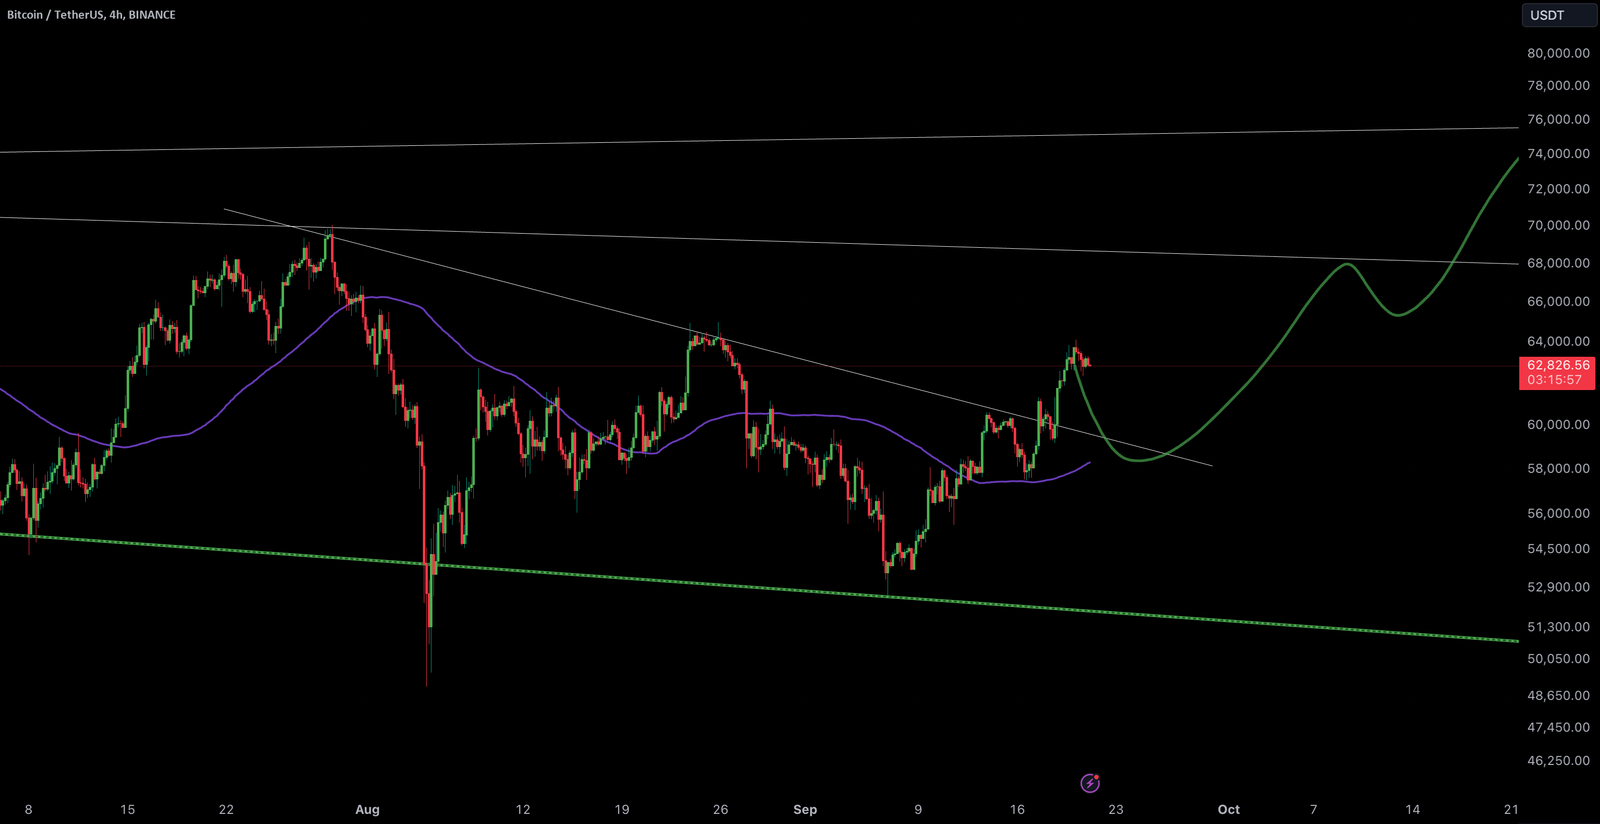
BTC/USDT 4HOUR CHART UPDATE !!

The price has recently broken a key downtrend line, which could signal the end of the current bearish trend.
Key support can be seen around the 60,000 USDT mark, with resistance levels closer to the 64,000 USDT region and further up near 74,000 USDT.
The price hovers near the 200-period moving average, which could act as a dynamic support or resistance.
Based on the green curve, there’s an expected retracement, potentially pulling back before making another upward movement toward higher levels. The chart suggests bullish momentum might resume after a consolidation.
Feel free to ask if you’d like more detailed breakdowns or specific targets based on these charts!
Disclaimer: This analysis is for informational purposes and not financial advice. Always stay updated with market movements and adjust your trading strategies as needed.
