
There is always a lot of debate while using chart whether to use EMA or SMA.
EMA = Exponential Moving Average.
SMA = Simple Moving Average.
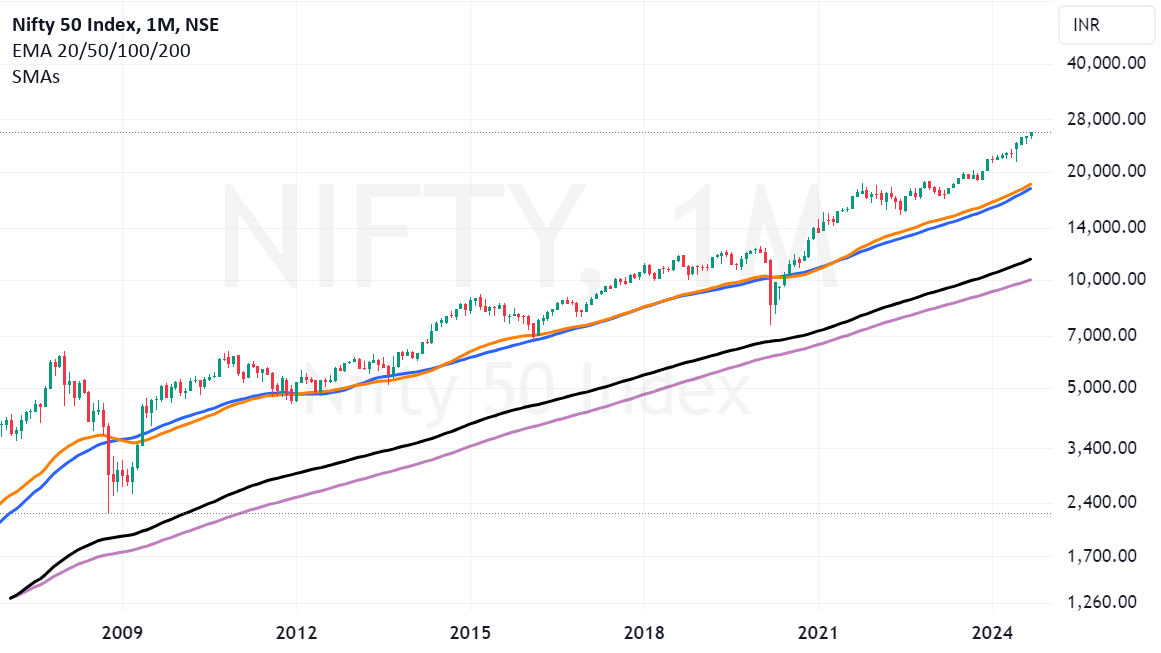
In the below chart Black and Orange lines represent 50 and 200 EMA. Blue and the Lavender line represent the 50 and 200 SMA.
Simple Moving average is the actual average of the kind of SMA you are using that is 50 SMA is average of last fifty closings. Exponential moving average gives more importance to the recent price and less to the past prices in that order. For example, if you are calculating 50 EMA the weightage given to yesterday’s price is more than the weightage given to the price before 49 days. I personally use EMA for my charts when I want to take entry to some stocks. As I feel recent price influence the move of the candles more than past prices for future upward movement. At the same time for Profit booking I give more importance to SMA and 21 SMA in particular as I base my trailing stop losses based on monthly average.
To know more about EMAs and SMAs and importance of EMAs in particular you can read my book. The Happy Candles Way to wealth creation available in Paperback and Kindle version on Amazon where I have explained my Mother, Father and Small Child theory where I consider 50 EMA as mother line 200 EMA as father line and movement of a candle is compared to movement of a child playing in garden. In a very simple way I have tried to explain Techincal analysis related to stock price movement and their relation to EMAs.
Now whichever EMA or SMA you use. What I feel is you should remain consistent with it. Do not keep switching between the two. As you can see from the chart there is no major difference in position of both lines in the chart specially when the EMA or SMA is smaller in number. Moving averages are very helpful in determining the trend of the stock. Chances of its correction and support the stock price will get while falling down or resistance it might face if the price is below those lines.
EMAs and SMAs are excellent support when the stock price is above them and become fierce resistnace when the stock price is below these lines. Thus knowing where they are with respect to price is very important. My advice will be EMA or SMA should be part of your chart. Which one you use is a matter of choice. Staying consistent to the moving average you choose is important as Harivansh Rai Bachhan the famous Poet has said in his most famous poem Madhushala and I quote him, “Rah Pakad tu ek chala chal pa jayega Madhushala”. Meaning be consistent to your path and you will find your target.
Disclaimer: There is a chance of biases including confirmation bias, information bias, halo effect and anchoring bias in this write-up. Investment in stocks, derivatives and mutual funds is subject to market risk please consult your investment advisor before taking financial decisions. The data, chart or any other information provided above is for the purpose of analysis and is purely educational in nature. They are not recommendations of any kind. We will not be responsible for Profit or loss due to descision taken based on this article. The names of the stocks or index levels mentioned if any in the article are for the purpose of education and analysis only. Purpose of this article is educational. Please do not consider this as a recommendation of any sorts.
